
Environmental indicators for urban mobility
The monitoring core of the ParkIN project. A three-tier platform processes data from the Park Your Car Around application to calculate environmental, economic and social indicators, from CO2 and particulate savings to time and fuel saved, and publishes them on a public, GDPR-compliant dashboard.
Developed by the Technical University of Crete with the Region of Attica in the ParkIN project, funded by the Green Fund (Natural Environment and Innovative Actions 2022). The dashboard is in Greek.
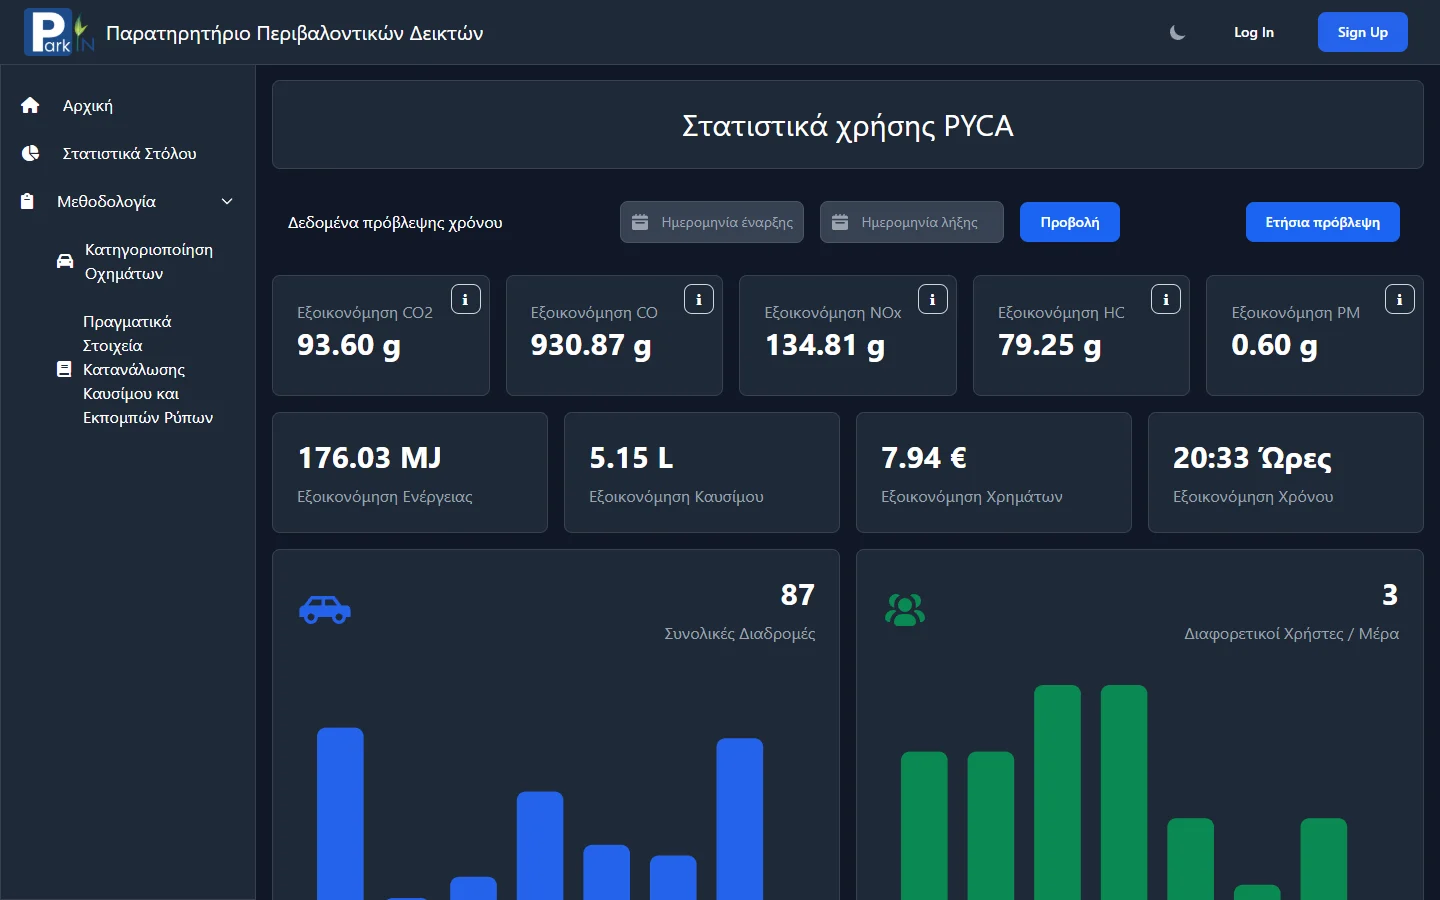
Indicators from real trips
Emission savings
Savings in CO2, CO, NOx, hydrocarbons and particulate matter from trips made with the application.
Energy, fuel, money and time
The same trips are converted into energy, fuel, cost and time saved.
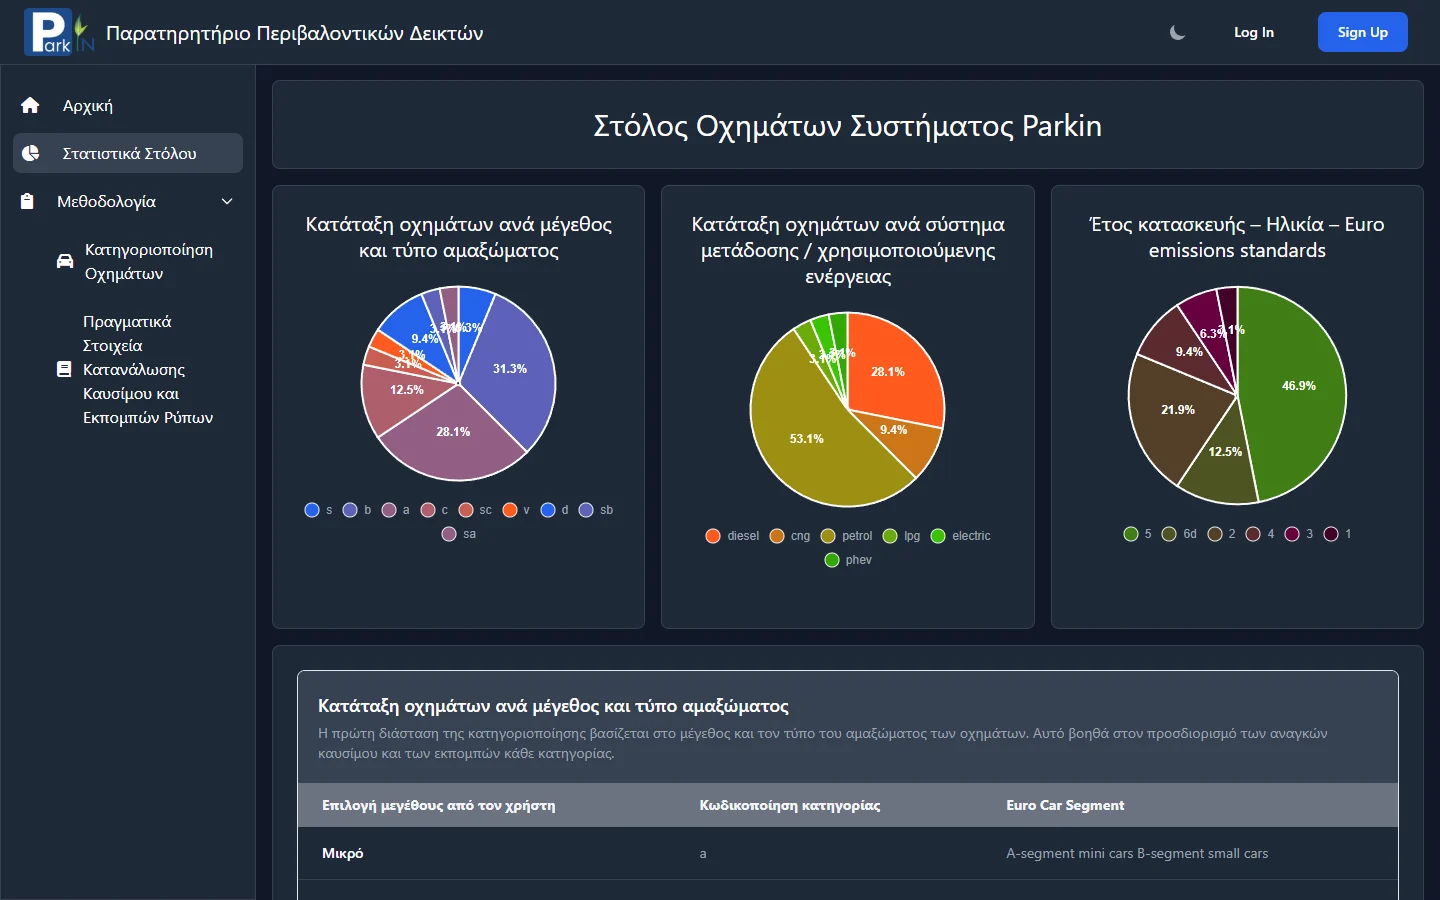
Fleet statistics
The vehicles in the system broken down by size and body type, fuel or powertrain, and Euro emission standard.
Real-world consumption
The methodology adjusts official WLTP figures towards real-world fuel use and emissions, using European Environment Agency data.
Fleet statistics and vehicle categories
From a parking app to public indicators
- 01
Register the vehicle
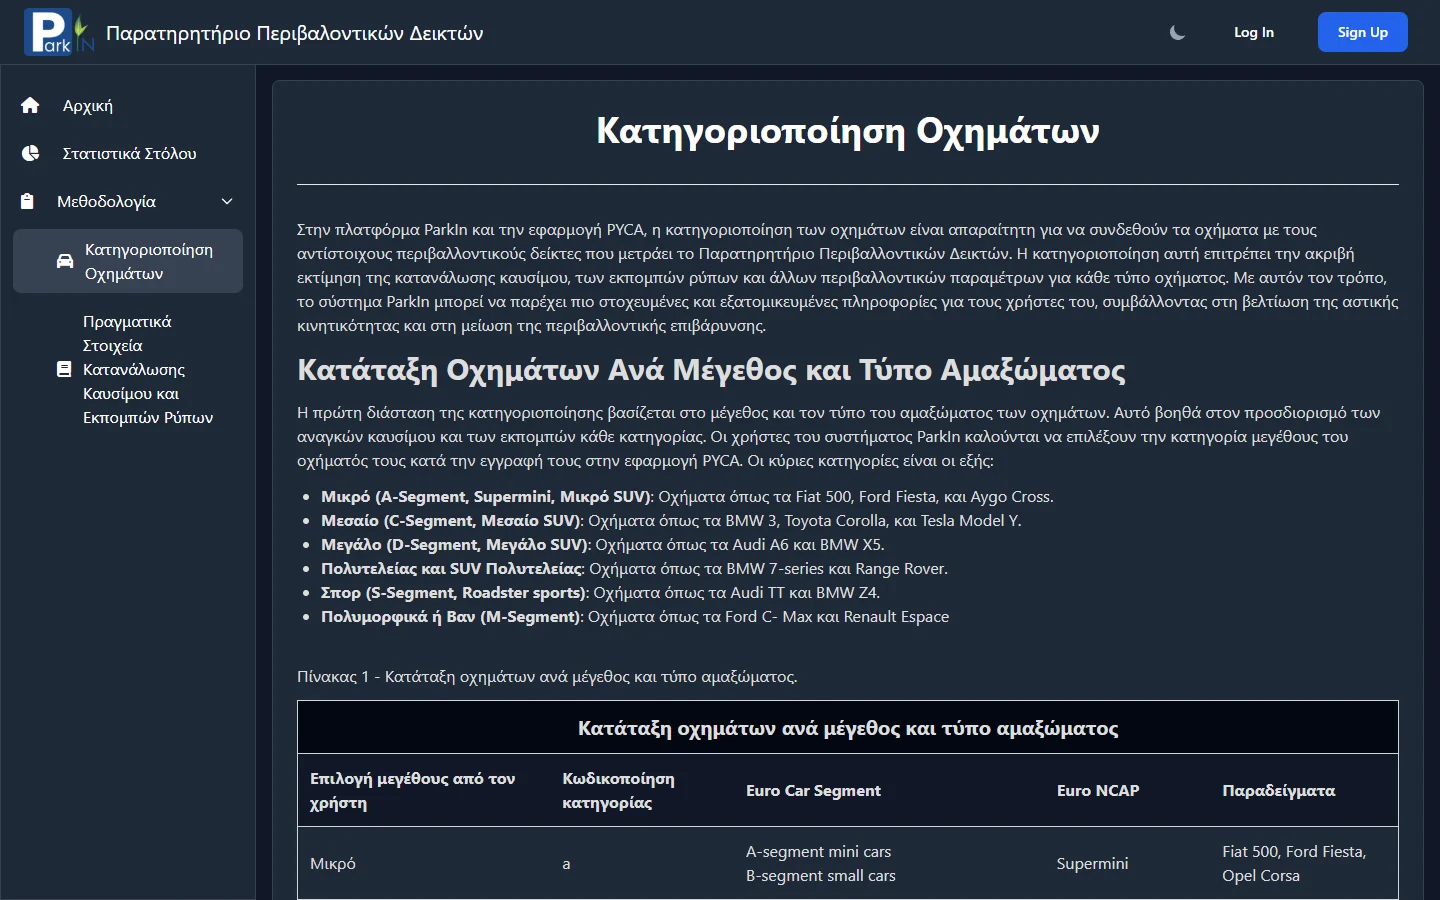
Users of the Park Your Car Around application choose their vehicle's size category.
- 02
Record trips
The application records routes and daily users.
- 03
Classify
Each vehicle is linked to a category by size, powertrain and emission standard.
- 04
Calculate
Real-world consumption and emission factors turn trips into savings.
- 05
Publish
Results appear on the public dashboard, with an annual forecast.